
Weather & Climate
104 sites
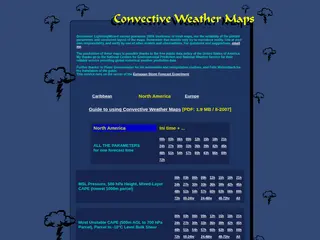
http://lightningwizard.com/maps/usa.html
Lightning Wizard provides detailed convective weather forecast maps for North America, Europe, and the Caribbean, pulling data from the National Centers for Environmental Prediction and the National Weather Service. The site covers advanced meteorological parameters like CAPE, bulk shear, and MSL pressure across multiple forecast time intervals, making it a valuable tool for storm chasers and weather enthusiasts.
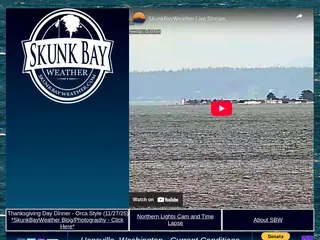
http://skunkbayweather.com/
Skunk Bay Weather is a hyperlocal weather station site based in Hansville, Washington, offering live conditions updated every minute including temperature, wind speed, and rainfall data from multiple sensors. The site also features webcams, Northern Lights time-lapse videos, aurora forecasts, air quality links, and contributes data to Weather Underground and other meteorological organizations.
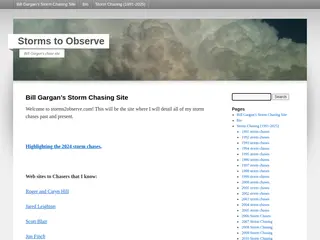
https://storms2observe.com/
Bill Gargan has documented his storm chasing adventures year by year from 1991 through 2025, creating a detailed personal archive of decades on the road pursuing severe weather. The site offers a rare long-term firsthand account of the storm chasing hobby, with annual chase logs and links to fellow chasers in the community.
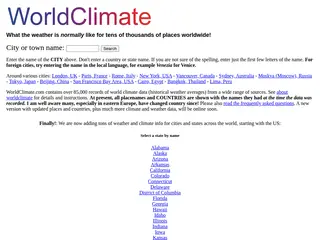
http://worldclimate.com/
WorldClimate.com is a comprehensive database of historical weather averages for over 85,000 locations worldwide, offering rainfall, temperature, and precipitation records spanning decades. Travelers, researchers, and curious minds can look up climate normals for cities from Bangkok to Lima, making it a handy reference for trip planning, relocation decisions, or general weather curiosity.
https://meteor.geol.iastate.edu/~jdduda/chasing/chasing.html
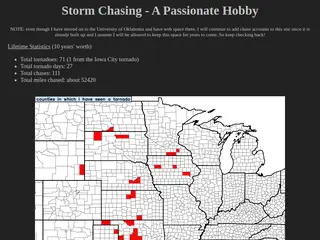
Jeff Duda, a geology student turned meteorology researcher, chronicles a decade of storm chasing with detailed chase accounts, busts, and lifetime statistics including 71 tornadoes over 111 chases and 52,000+ miles. Each year from 2008 to 2017 has its own dedicated page, making this a substantial firsthand log of severe weather pursuit across the Great Plains and Midwest.
https://westislandweather.com/
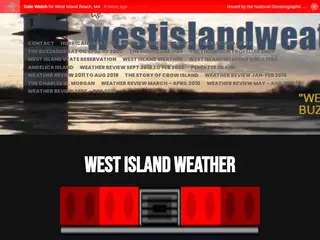
West Island Weather Station has been monitoring coastal conditions near the Cape Cod Canal in Buzzards Bay, Fairhaven, Massachusetts since 1992, offering live bay cams, tide information, and detailed monthly weather logs. The site also chronicles notable regional weather events including Hurricane Bob 1991, the Blizzard of '78, and the Buzzards Bay Oil Spill of 2003, alongside an archive of over 10,000 photos.
http://stormpursuit.com/
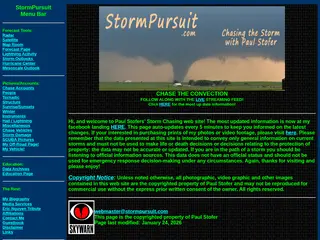
Paul Stofer's StormPursuit is a comprehensive storm chasing hub featuring chase accounts, live streaming, tornado photography, and real-time severe weather tools including radar, satellite, and mesoscale outlooks. The site offers an impressive archive of storm structure photos, hail and lightning images, and educational resources for anyone fascinated by severe weather.
http://cycloneroad.com/
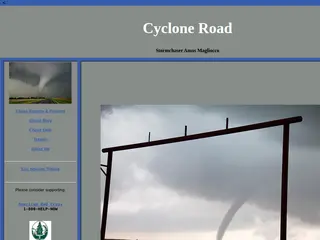
Cyclone Road is the personal homepage of storm chaser Amos Magliocco, featuring chase reports, photos, a chase blog, and gear recommendations. The site includes a tribute to Eric Nguyen and links to essential storm chasing reading on safety, ethics, and tornado pursuit.
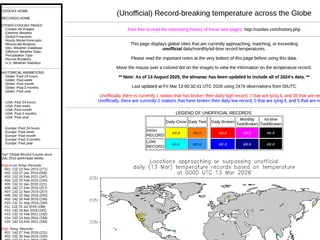
http://coolwx.com/record
CoolWx tracks unofficial record-breaking temperatures across the globe, cataloging high and low temperature records from over 3,800 weather stations dating back to July 2010. Visitors can explore historical animations of weather patterns by region and time period, as well as ranked lists of the most prolific record-breaking days in recent climate history.
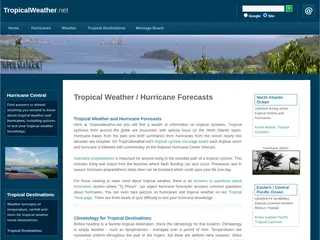
https://tropicalweather.net/
Tropicalweather.net is a comprehensive resource covering tropical cyclones, hurricane forecasts, and preparedness tips, with special focus on the North Atlantic basin and nearly two decades of historical hurricane summaries. Visitors can test their knowledge with trivia quizzes at three difficulty levels, browse climatology data for Caribbean cruise destinations, and even explore career paths in TV meteorology.